D3.js Order Map
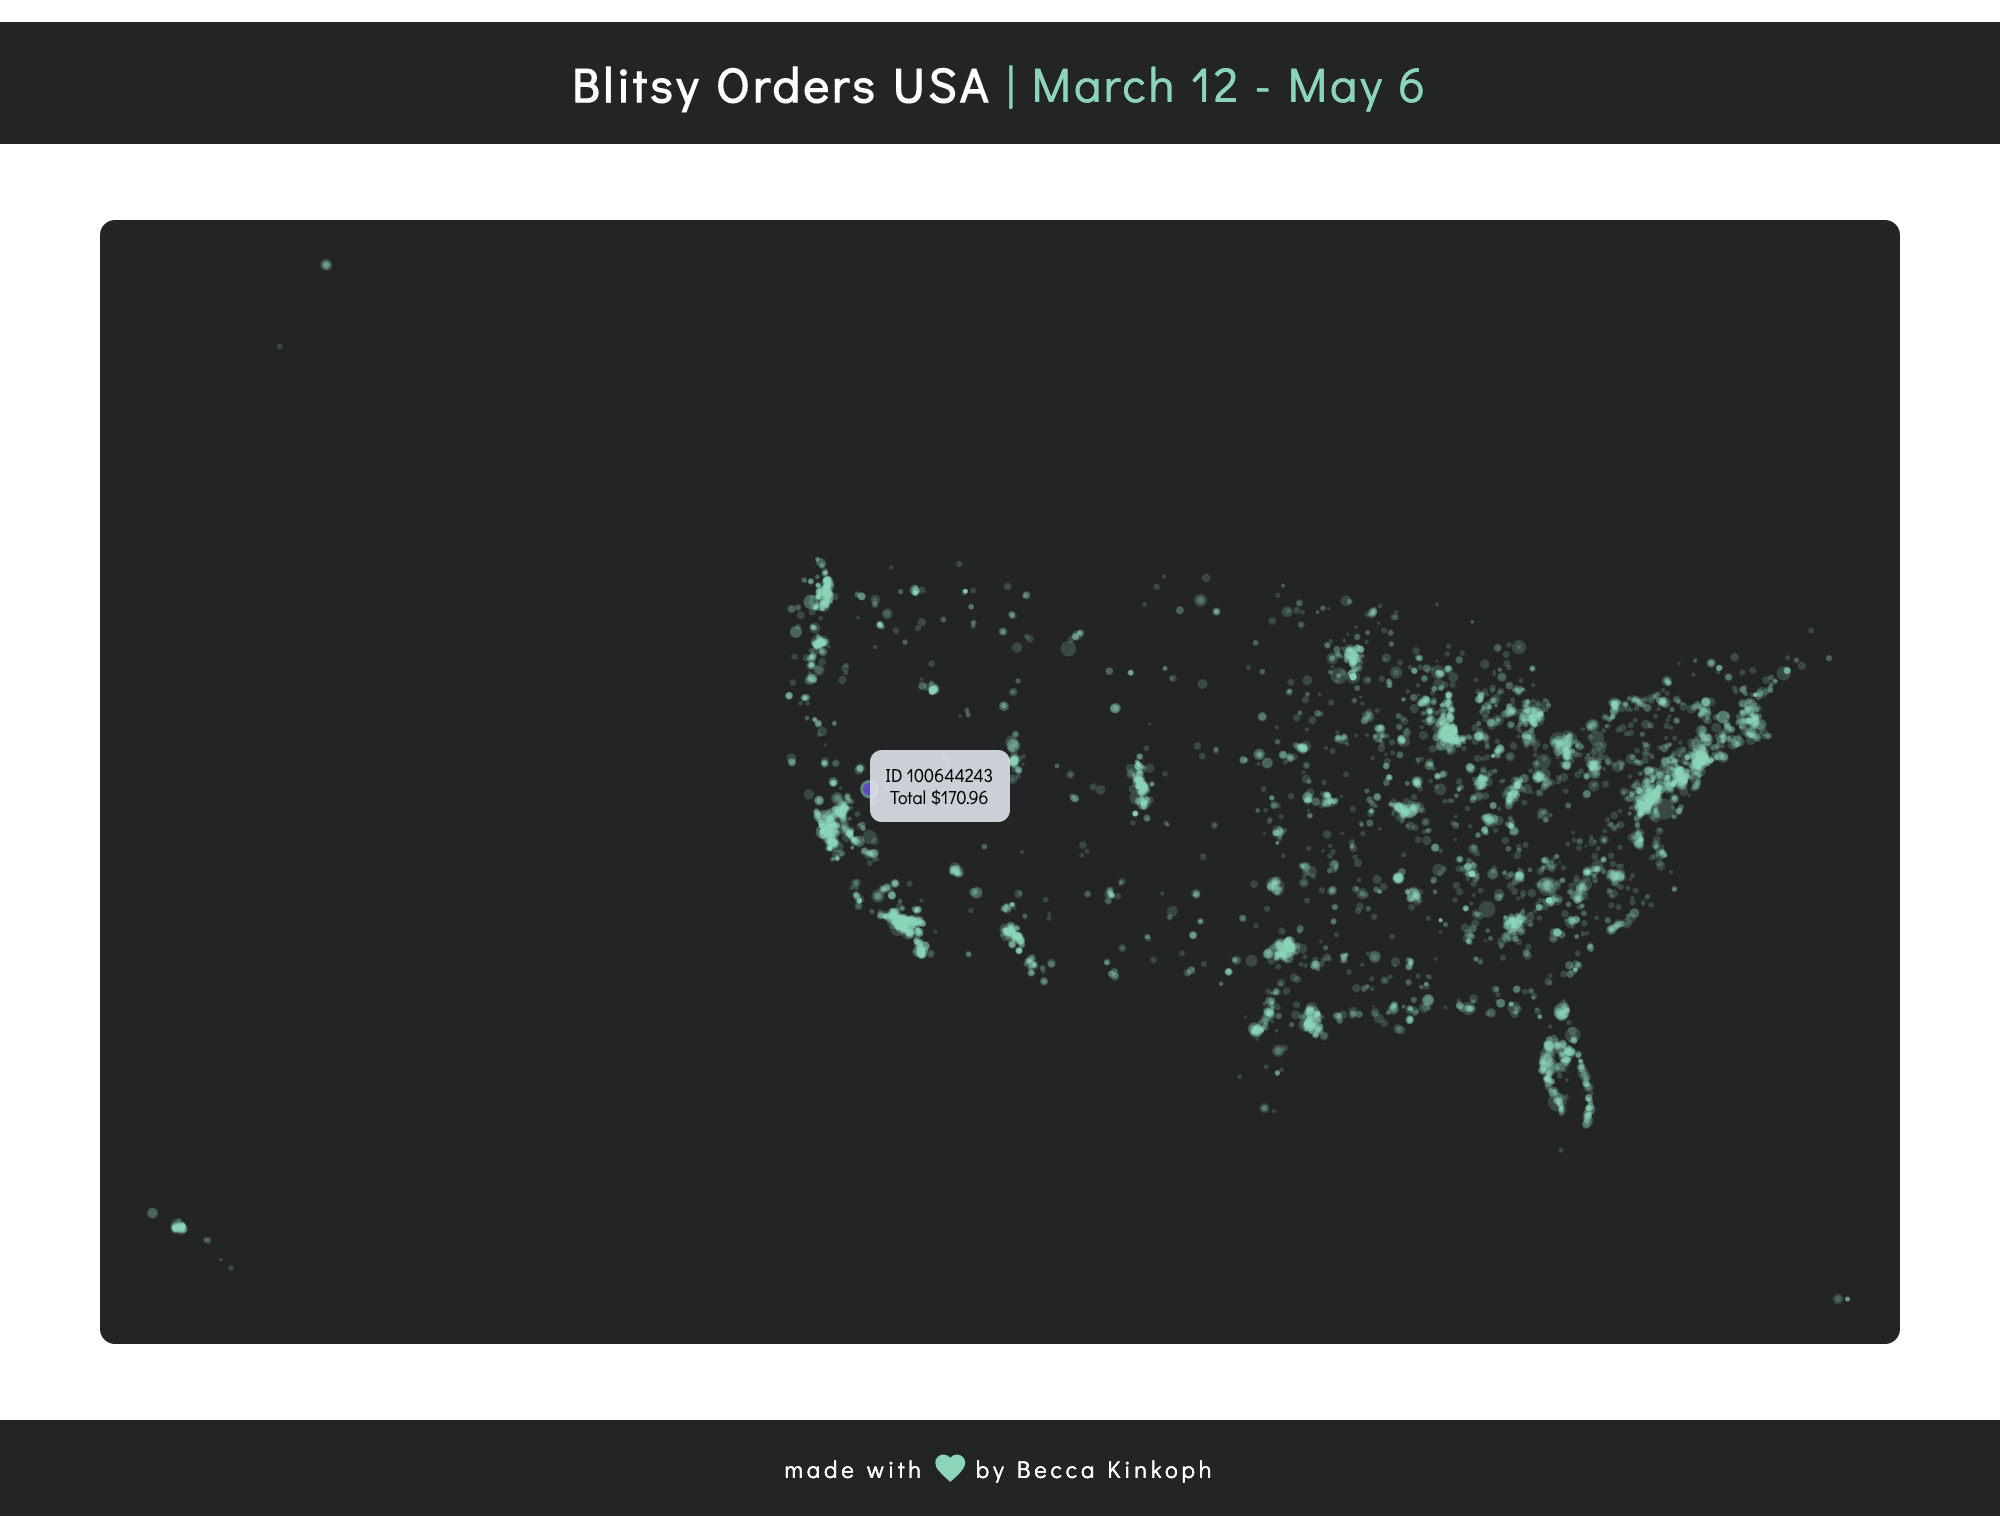
Project done using D3.js (Data Driven Documents). We had a mini hackathon at work and the prompt was to create a way to visualize data that could be useful. We were given complete creative freedom. I decided to come up with a way to visualize where our orders were being shipped and the amount spent on each order. Using the collected data, I was able to get the latitude/longitude coordinates of each order via the shipping address, the dollar amount spent per order, and order ID. I plotted the latitude/longitude coordinates on the X and Y axis, and set the radius of each circle (representing an order) to a ratio of pixels to dollar amount. The result was this map visualization showing where orders had been shipped and how large the order. I dropped the opacity of each circle to show orders which overlapped by location. This way, the opacity corresponds to the quantity of orders placed in a geographical location. Hovering over individual circles will display the order’s ID and dollar amount spent. This project was done for fun, but could easily be functional in a dashboard or other applications.